TechTips by SDAS

Helping you drive more value from your subscription with useful tips and guidance.

Latest TechTips

Make your graphs stand out

Using -schemes- in Stata allows your graphs to take on a different look and feel to the regular Stata graphs. You can use one of the many schemes already included such as s2color, sj or economist or you can build your own.
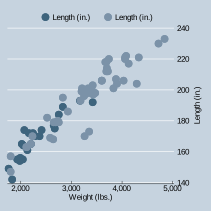
graphs, schemes, stata

Adding a Title to a Graph

How to add and customise graph titles in Stata, including text size, colour, positioning, multiple lines and subtitles.
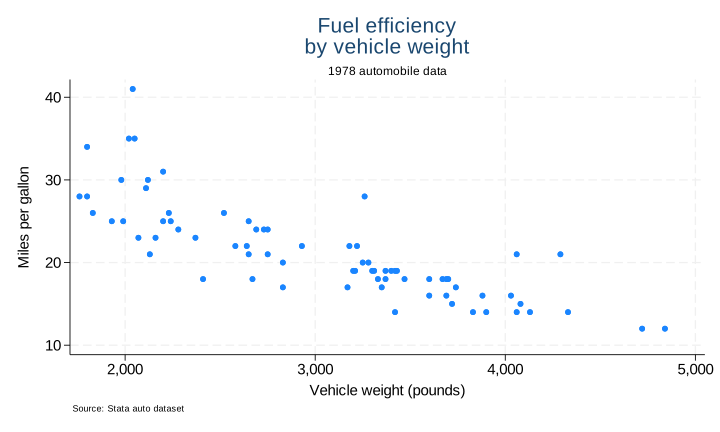
graphics, stata

Comparing Economic Indicators in a Time-Series Chart

How to combine and standardise five economic datasets to create a single time-series chart in Stata, comparing interest rates, inflation, the S&P 500, the Big Mac Index and AUD/USD over 27 years.
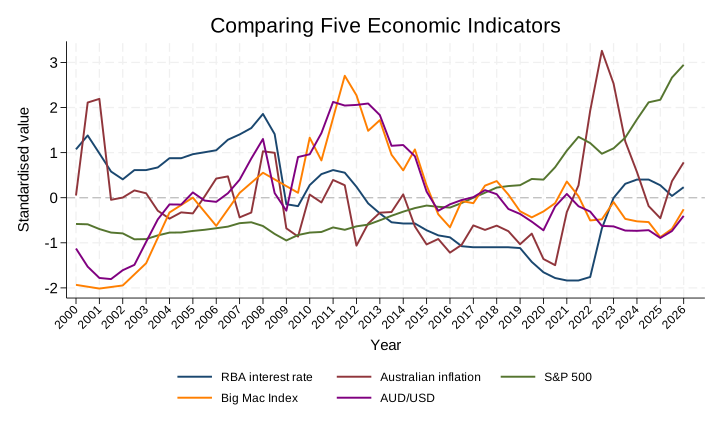
data management, graphics, importing data

External Resources

Helpful guides from fellow Stata users

Todd Jones

Quick Stata Tips

A quick fire compilation of lesser known Stata tips. Even seasoned Stata users will find something new in this book.

Asjad Naqvi

The Stata Guide on Medium

The Stata Guide repository on GitHub

The Stata Guide includes is a series of smaller guides on topics from maps to workflow to programming. It includes a lot of cool data visualisations and even ready-to-use Stata packages for some of the guides focusing on graphics.

Demetris Christodoulou

Graph workflow

The Graph Workflow is a website full of data graphs focusing on accurate, informative and efficient graphs for reporting, exploratory and inferential purposes. All Stata code for each graph is provided.

John Kane

Getting More Out of Stata’s Graph Editor: A Concise Guide

The ultimate guide to Stata's Graph Editor designed for both beginner and more advanced Stata users.

Jan Kabátek

How to handle large datasets in Stata

An excellent guide on how to navigate the issue of insufficient memory when handling large datasets.