Using Asjad's 'Bumpline' Package to Map the 2025 AFL Season
The first step was to record round-by-round ladder data from the official AFL website, noting each team’s position (1-18) at the conclusion of each round (1-24). You can load this dataset directly from our website:
webuse set https://techtips.surveydesign.com.au/datasets

webuse afl2025.dta, clear
First we generate a new variable: result_rev which is equal to 19 - result. This means that the team in position 1 at the end of each round will show at the top of the bumpline as they will have the highest result_rev value.
generate result_rev = 19 - result
Next we generate a focus variable which will be set equal to a unique number 1-18 for each team. We will use the colorby(focus) option to ensure each team will have a unique color.
bysort team (round): egen focus = max(cond(round == 1, result, .))
To install the Bumpline package we need to use the following command:
net install bumpline, from("https://raw.githubusercontent.com/asjadnaqvi/stata-bumpline/main/ins
> tallation/") replace
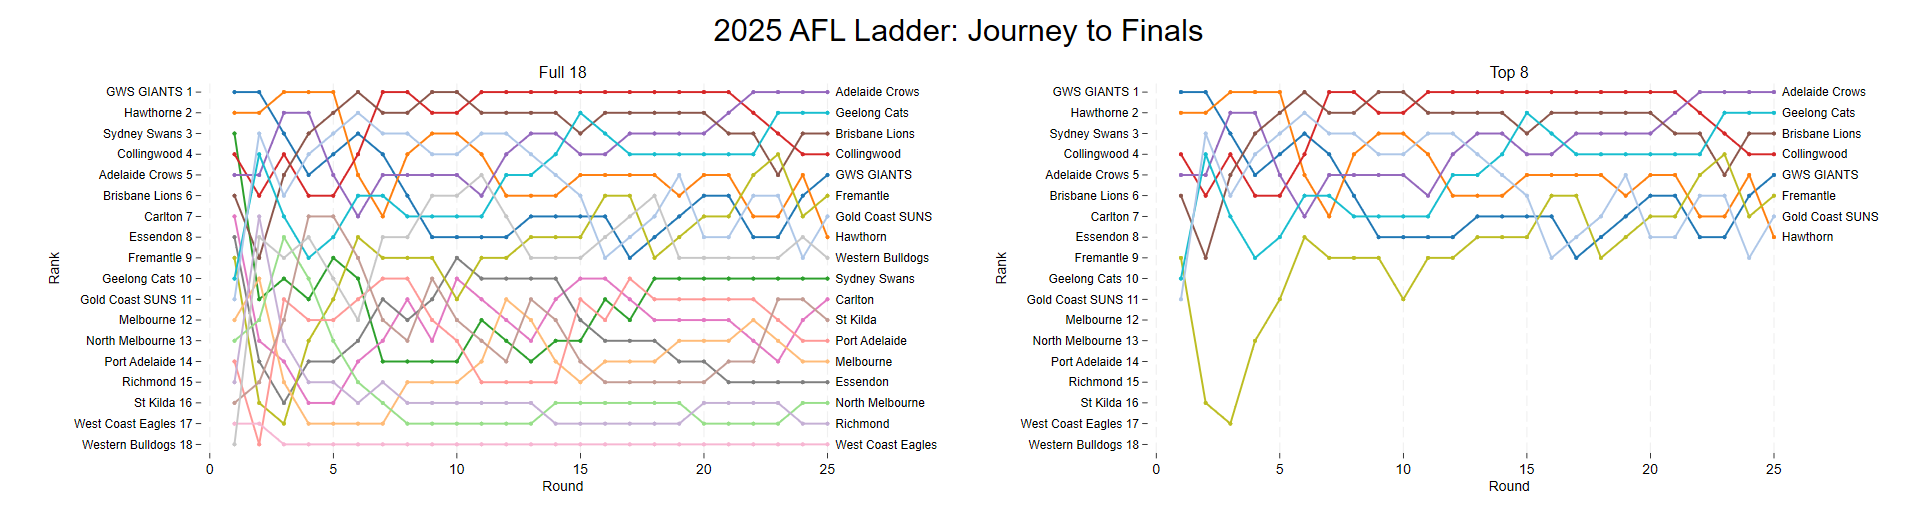
Now we can generate our Bumpline graph:
bumpline result_rev round, by(team) ///
> ylabel(18 "GWS GIANTS 1" 17 "Hawthorne 2" 16 "Sydney Swans 3" ///
> 15 "Collingwood 4" 14 " Adelaide Crows 5" 13 "Brisbane Lions 6" ///
> 12 "Carlton 7" 11 "Essendon 8" 10 "Fremantle 9" 9 "Geelong Cats 10" ///
> 8 "Gold Coast SUNS 11" 7 "Melbourne 12" 6 "North Melbourne 13" ///
> 5 " Port Adelaide 14" 4 "Richmond 15" 3 "St Kilda 16" ///
> 2 "West Coast Eagles 17" 1 "Western Bulldogs 18") ///
> top(18) colorby(focus) lw(0.5) ms(0.5) smooth(1) ylabs(3) ///
> labs(3) name(Full, replace) aspect (0.5) title("Full 18", size(4))
We can use the select() option to show the movements of each team that ended up making finals:
bumpline result_rev round, by(team) top(8) select(last) ///
> colorby(focus) lw(0.5) ms(0.5) smooth(1) ylabs(3) labs(3) ///
> ylabel(17 "GWS GIANTS 1" 16 "Hawthorne 2" 15 "Sydney Swans 3" ///
> 14 "Collingwood 4" 13 " Adelaide Crows 5" 12 "Brisbane Lions 6" ///
> 11 "Carlton 7" 10 "Essendon 8" 9 "Fremantle 9" 8 "Geelong Cats 10" ///
> 7 "Gold Coast SUNS 11" 6 "Melbourne 12" 5 "North Melbourne 13" ///
> 4 " Port Adelaide 14" 3 "Richmond 15" 2 "St Kilda 16" ///
> 1 "West Coast Eagles 17" 0 "Western Bulldogs 18") ///
> name(Top, replace) aspect(0.5) title("Top 8", size(4))
Finally, we can combine the two graphs onto one graphic, showing the journey to finals for the top 8 teams as well as the performace of every team throughout the season. The bumpline allows us to easily compare performaces from the 2024 and 2025 seasons as the first round in our data shows the position of each team at the closure of the previous season.
graph combine Full Top, ///
> title("2025 AFL Ladder: Journey to Finals", size(6)) xsize(11) ysize(3)
Asjad Naqvi, 2023. “BUMPLINE: Stata module to produce bump line graphs,” Statistical Software Components S459195, Boston College Department of Economics, revised 15 Mar 2025.