A Centred Bar Plot in Stata
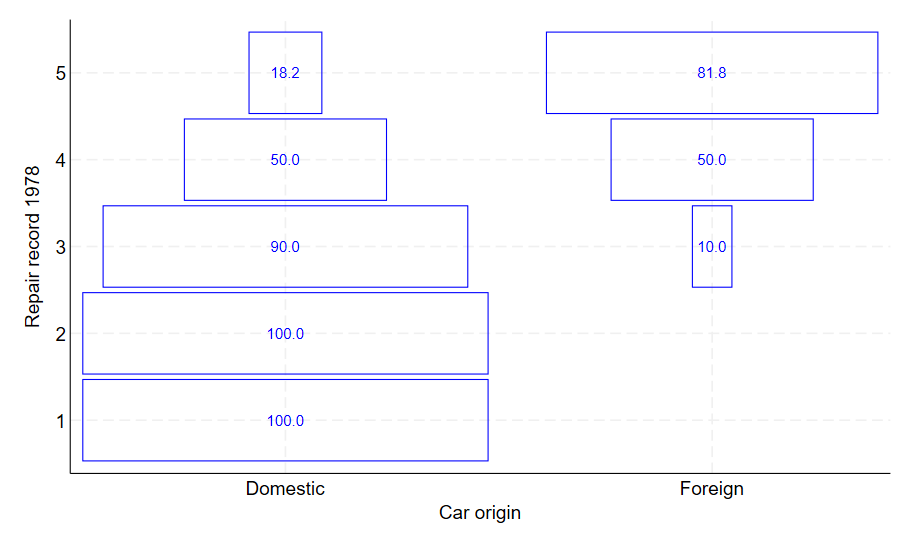
Centred bar plots are used to show the frequency(absolute or relative) of the y-variable as centred horizontal bars. These are commonly used in archaeology and may also be known as battleship curves or battleship diagrams.
To create a centred bar plot in Stata, you first need to download the cbarplot command from the SSC. You can do this in Stata with the following command:
ssc install cbarplot
To generate this graph in Stata, use the following commands:
sysuse auto, clear
cbarplot rep78 foreign, percent(rep78)