A COVID-19 Choropleth Map for Indonesia
Previously I have written about making choropleth maps in Stata, with examples using COVID19 data for Australia and New Zealand. In this post we create another choropleth map, this time with COVID19 data from Indonesia. I have acquired the requisite GIS ESRI shape files for Indonesia from data.humdata.org here as well as the COVID19 data by province here.
We start by first importing the map data and making sure the map works. In the command pane:
spshape2dta "C:\PATH_TO_DOWNLOADED_MAP_FOLDER\idn_admbnda_adm1_bps_20200401"
This gives the following output, as expected:
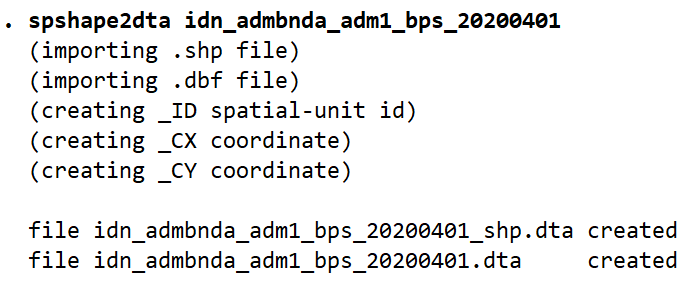
Note: this will save the two files in your current working directory, not the directory the database and shapefiles are saved in. You can move them, however make sure both files are always together in the same folder.
Let’s test the map. In the command pane:
use idn_admbnda_adm1_bps_20200401.dta, clear
grmap

Our basemap appears to have imported correctly. Now to get the COVID19 data into Stata. In the command pane:
clear all
import delimited "C:\PATH_TO_DOWNLOADED_FILES\Case by Provinces - IDN-COVID19 - Sheet2.csv", clear
The data appear to have imported correctly, however there is a discrepancy with one of the province names. In the map data Jakarta is recorded as “Dki Jakarta” however in the COVID19 data it is recorded as “DKI Jakarta”. While the only difference here is capitals, if the names are not exactly the same the data will not merge correctly. To change the COVID19 province spelling with the map province spelling I use the replace command:
replace province_name = "Dki Jakarta" if province_name == "DKI Jakarta"
save coviddata-ind.dta, replace
I will now merge the COVID19 data with the map data. In the command pane:
clear all
use idn_admbnda_adm1_bps_20200401.dta
rename ADM1_EN province_name
merge 1:1 province_name using coviddata-ind.dta
grmap confirmed_cases
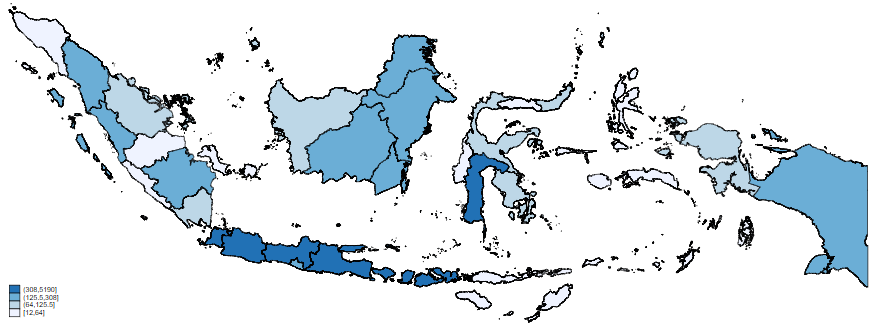
Like the maps of New Zealand and Australia, this map is showing infection count data. It does not take into account the different population sizes of the different districts. Like before, I will now merge province population data (previously obtained from Wikipedia). This allows me to draw a map showing the percentage of population that has contracted the virus. In the command pane:
drop _merge
merge 1:1 province using population-ind.dta
generate casespercent = (confirmed_cases/population)*100
grmap casespercent
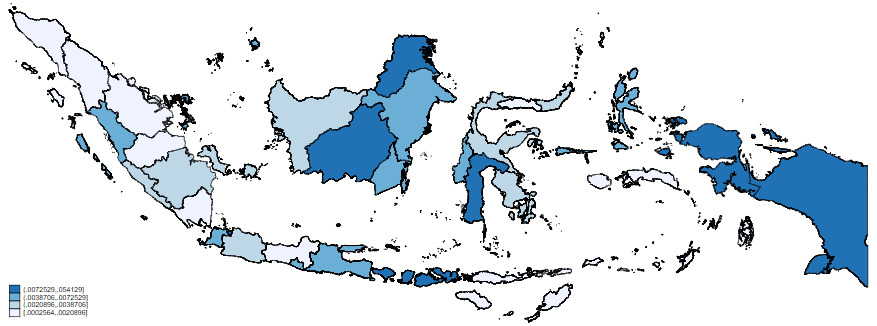
We can see the most obvious changes through the bottom string of land, where the percentage of population infected shows a relatively low number of infections compared to the basic count data. Conversely, the area of land on the right shows a comparatively high percentage of the population infected despite the lower number of cases.