A Matrix Plot in Stata
A matrix graph plots the values of a matrix as squares of different colours, with higher values represented as darker colours.
To create a matrix plot in Stata you first need to download the plotmatrix command from the SSC, which you do with the following command in Stata:
ssc install plotmatrix
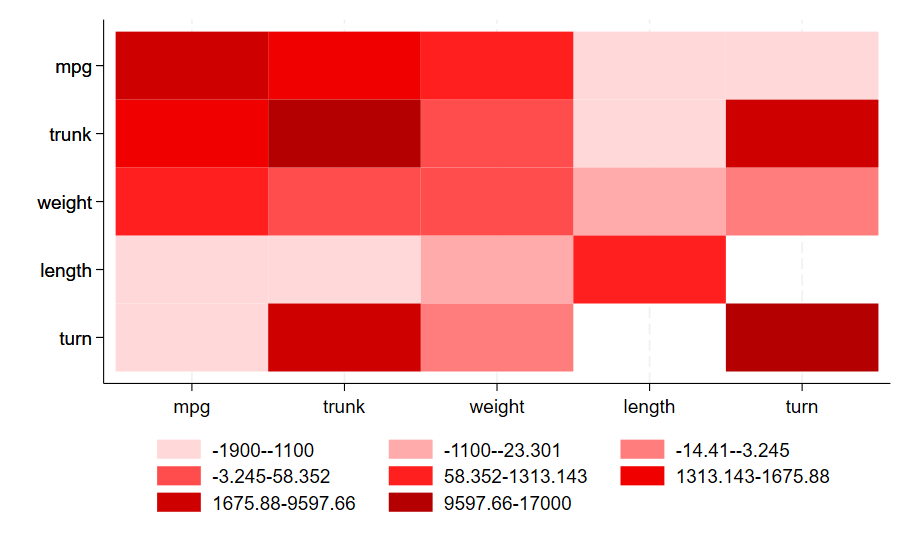
To generate this graph in Stata, use the following commands:
sysuse auto, clear
regress price mpg trunk weight length turn, noconstant
matrix regress\_matrix = e(V)
plotmatrix, m(regress\_matrix) color(red) ylabel(,angle(0)) legend(pos(6))