A Trellis Graph Array in Stata
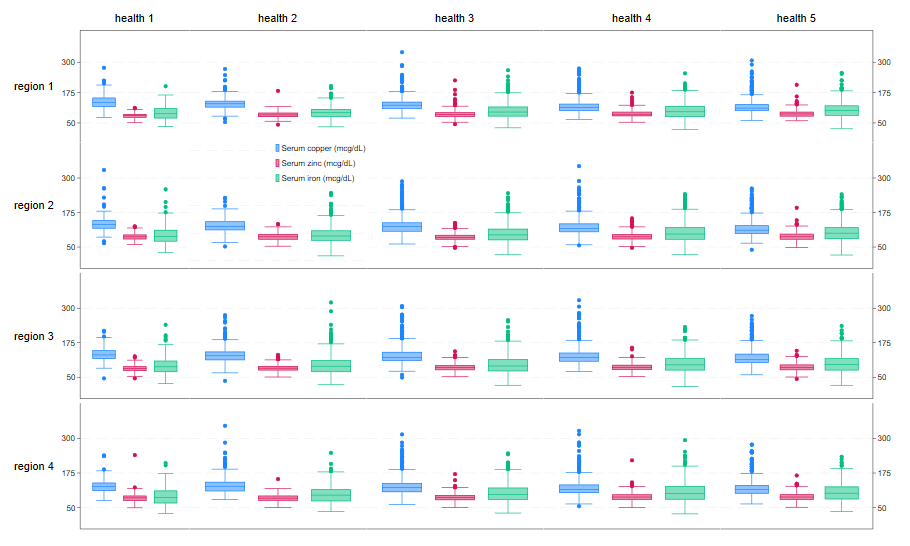
A trellis plot is really a combined set of plots broken down by the different categories of two factor variables. It displays the selected graph of interest broken down by two different factor variables so you can visually determine how much the graph changes depending on the influence of the factor variables.
To create a trellis array in Stata, you first need to download the trellis command from the SSC, which you do within Stata using the following command:
ssc install trellis
To generate this graph in Stata, use the following commands:
webuse nhanes2f, clear
trellis, by(health region) function(graph box copper zinc iron) fopt(legend(off) ylabel(50 175 300) yscale(r(50,310))) sr(2) sc(2) singleopt(legend(on ring(0) pos(1) col(1) bm(tiny) symx(\*0.2) keyg(\*0.2) region(m(zero) lw(none))) yscale(r(50,310))) name(trellis)