Add Data Tables to your Document - The Putdocx Command
The putdocx command was added in Stata v15 and has been expanded with new features in subsequent versions. It allows you to create Microsoft Word documents from within Stata. The command allows you to embed Stata outputs or results as tables or paragraphs, embed Stata graphs as images, and create formatted paragraphs – all without ever having to open Microsoft Word.
In this section we look at how to create data tables using the putdocx command. There are four main types of tables that can be created and added to a word document, and these are: a table created using Stata’s new and improved table command and the suite of related collect commands; a table created from the data in memory (your active dataset); a table created from a Stata or Mata matrix; and a table created from the last estimation command, margins command or model (displayed by estimates table) you ran in Stata (eg -regress- is an estimation command).
How to Use:
Add a table created with Stata’s new table and collect commands, and/or the new Tables Builder (v17+ only):
putdocx collect
Create a table from data in memory:
putdocx table table_name = data(var1 var2 var3)
Create a table from a Stata or Mata matrix:
putdocx table table_name = matrix(matrix_name)
putdocx table table_name = mata(matrix_name)
Create a table from an estimation command, margins command or model:
putdocx table table_name = etable
Adding row/column names, table title and table notes:
putdocx table table_name = matrix(matrix_name), rownames colnames
putdocx table table_name = data(var1 var2 var3), obsno varnames
putdocx tabe table_name = mata(matrix_name), title(Title)
putdocx table table_name = etable, note(This is a note)
Specify table border formatting
putdocx table table_name = matrix(matrix_name), border(all)
putdocx table table_name = etable, border(top) border(bottom)
putdocx table table_name = data(var1 var2 var3), border(start) border(end)
putdocx table table_name = mata(matrix\_name), border(insideV) border(insideH)
putdocx table table_name = etable, border(top, nil)
NOTE: If you are adding a table built using the new table and collect commands or the Tables Builder, all editing can be done with the suite of collect commands prior to adding it to the document. You only need the putdocx formatting commands for tables not generated in this way.
Worked Example 1:
In this example I will generate a simple cross-tabulation using the new table command, and add it to a document using putdocx collect.
sysuse auto, clear
putdocx clear
putdocx begin
table rep78 foreign
collect style header foreign, title(hide)
putdocx collect
putdocx save example1
This produces a table that looks like this:
| Domestic | Foreign | Total | |
|---|---|---|---|
| Repair record 1978 | |||
| 1 | 2 | 2 | |
| 2 | 8 | 8 | |
| 3 | 27 | 3 | 30 |
| 4 | 9 | 9 | 18 |
| 5 | 2 | 9 | 11 |
| Total | 48 | 21 | 69 |
Worked Example 2:
In this example I will generate a table using the dataset in Stata’s memory. In the command pane I type the following:
sysuse auto, clear
putdocx clear
putdocx begin
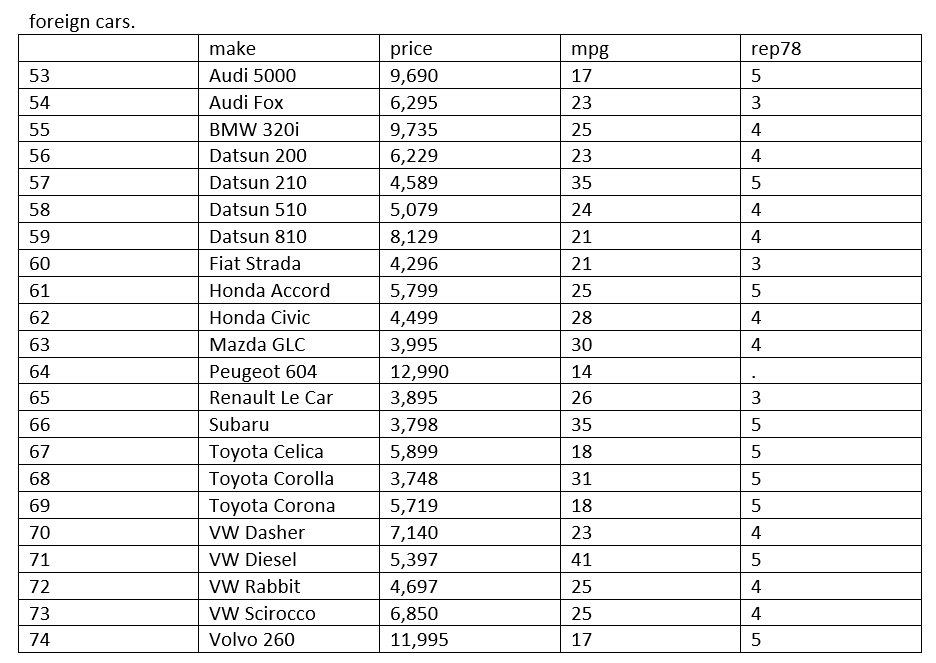
putdocx table data = data(make price mpg rep78) if foreign==1, title(Foreign cars.) obsno varnames
putdocx save example2
This generates a table of foreign cars, listing the price, mpg and repair record of each. There is a small title added to the top of the table stating this is a table of “Foreign cars.”, while the obsno option adds the observation number in the left-most column and the varnames option adds the variable names along the top row. You can see an image of the generated table below:
Worked Example 3:
In this example I perform a simple regression using the Stata auto example dataset, and I then add the regression output to a word document. In the command pane I type the following:
sysuse auto, clear
putdocx clear
putdocx begin
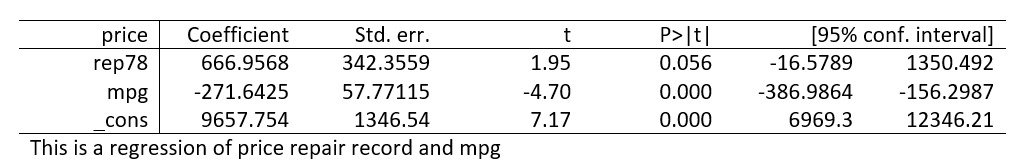
regress price rep78 mpg
putdocx table reg = etable, note(This is a regression of price repair record and mpg)
putdocx save example3
This outputs a table to the word document which I then save as example2.docx. The file is saved in my current working directory, which I have left as the default. An image of the generated table is below:
Worked Example 4:
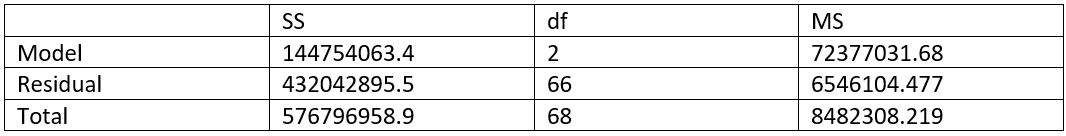
In the previous example I added a regression table to a word document, however only one table was added. A second table containing statistics used to calculate the regression model was not added using the etable method. Even though this table is not saved, I can use the scalars saved when the regression model was run to re-create the table as a matrix. I can then add the matrix to a word document as a table.
The sum of squares (SS) are saved as “e(mss)” for the model and “e(rss)” for the residual. The degrees of freedom (df) are saved as “e(df_m)” for the model and “e(df_r)” for the residual. The mean squares (MS) is calculated by dividing SS by df. In the command pane I type the following:
sysuse auto, clear
putdocx clear
putdocx begin
regress price rep78 mpg
local ms = (e(mss)+e(rss))/(e(df_m)+e(df_r))
local ms_m = e(mss)/e(df_m)
local ms_r = e(rss)/e(df_r)
matrix stats = (e(mss),e(df_m),`ms_m'\e(rss),e(df_r),`ms_r'\e(mss)+e(rss),e(df_m)+e(df_r),`ms')
matrix colnames stats = SS df MS
matrix rownames stats = Model Residual Total
putdocx table reg_stats = matrix(stats), rownames colnames
putdocx save example4
The rownames and colnames options add the specified row and column names for the matrix to the generated table. An image of the generated table is below:
Worked Example 5:
In this final example I am going to create all three tables from a standard regression output using Stata’s new collect commands.
sysuse auto, clear
putdocx clear
putdocx begin
collect p=Ftail(e(df_m),e(df_r),e(F)) ms=(e(mss)+e(rss)/e(df_m)+e(df_r)) mms=e(mss)/e(df_m) rms=e(rss)/e(df_r) df=e(df_m)+e(df_r) ss=e(mss)+e(rss): regress price mpg weight length
collect layout (colname) (result[_r_b _r_se _r_z _r_p _r_ci])
collect style header colname, level(value)
collect label levels result _r_ci "[__LEVEL__% conf. interval]", modify
collect label levels result _r_p "P>|t|", modify
collect label levels result _r_se "Std. err.", modify
collect style cell cell_type[column-header], halign(center)
putdocx collect

collect addtags source[Model], fortags(result[df_m mss mms])
collect addtags source[Residual], fortags(result[df_r rss rms])
collect addtags source[Total], fortags(result[df ss ms])
collect addtags squares[SS], fortags(result[mss rss ss])
collect addtags squares[df], fortags(result[df_m df_r df])
collect addtags squares[MS], fortags(result[mms rms ms])
collect layout (source) (squares)
collect style cell, nformat(%11.0g)
collect style cell cell_type[column-header], halign(center)
putdocx collect

collect layout (result[N F p r2 r2_a rmse])
collect label levels result N "Number of obs", modify
collect label levels result F "F(3, 70)", modify
collect label levels result p "Prob > F", modify
collect label levels result r2_a "Adj R-squared", modify
collect label levels result rmse "Root MSE", modify
collect style cell, nformat(%6.0g)
collect style cell, minimum(.00001, label(`".0000"'))
putdocx collect
putdocx save example5
This produces the following table in Word:

Once you save your document with the putdocx save command the document will be closed. If you do not want to save your document you can use -putdocx clear- to clear everything from the document. Please be aware that doing so without saving will cause you to lose everything you added to the document.