Box Plot with Whiskers and Outliers
The graph shown below makes use of the auto data set which comes with Stata. This graph in particular incorporates the: mean, range, inter-quartile range and outliers. This makes the graph very rich and means quite a bit of information can be divined from it.
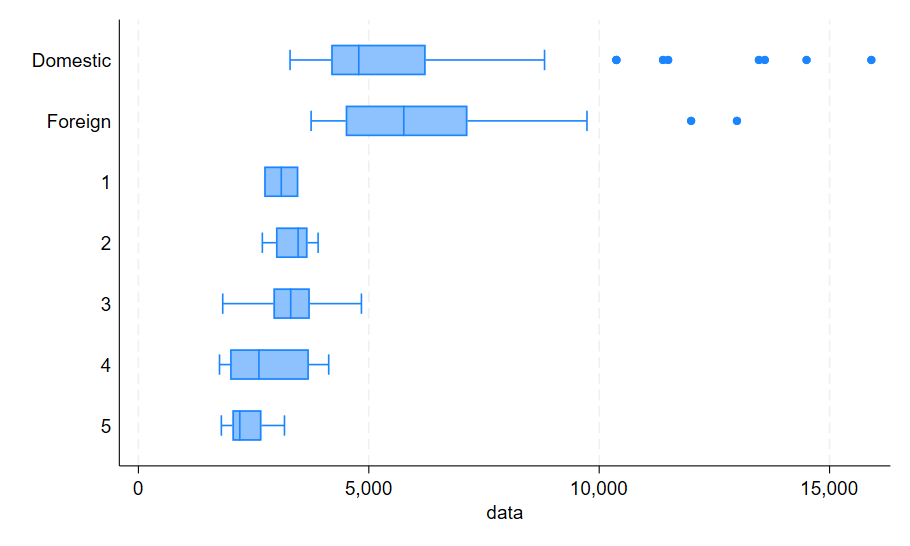
The above graph can be created using the following code:
use http://www.stata-press.com/data/r10/auto, clear
preserve
tempfile mylabel
label save origin using `mylabel'
replace rep78 = rep78 + 2
stack price foreign weight rep78, into(data foreign) clear
label def _stack 1 "`l1'" 2 "`l2'"
label val _stack _stack
do `mylabel'
label def origin 3 "1" 4 "2" 5 "3" 6 "4" 7 "5", add
label val foreign origin
graph hbox data, over(foreign)