Distribution plot in Stata
You can produce a distribution plot in Stata. I have produced a worked example using the auto.dta dataset. The graph is shown below:
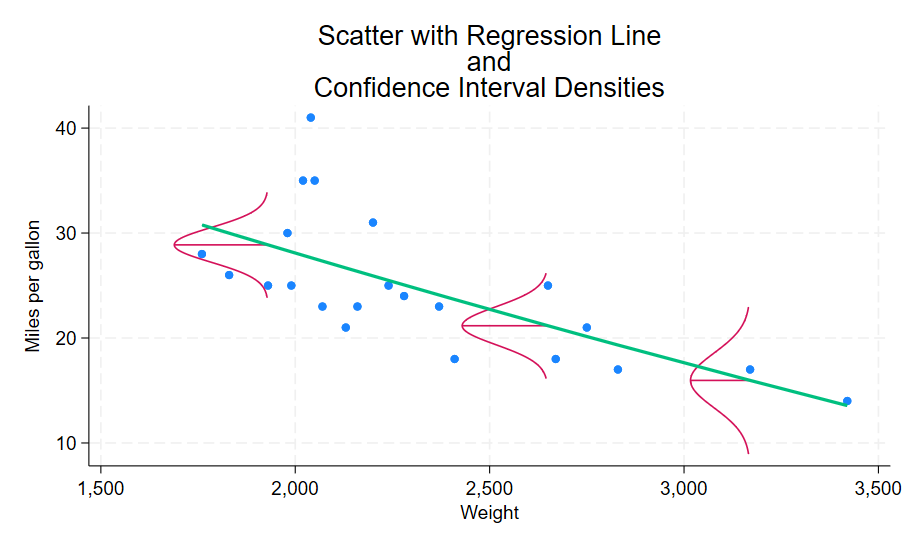
To create the graph above, I used the following commands:
sysuse auto, clear
keep if foreign
sort weight

generate weight2 = weight^2
regress mpg weight weight2
predict fit
predict se , stdp

scatter mpg weight, legend(off) ytitle(Miles per gallon) xtitle(Weight) title("Scatter with Regression Line" "and" "Confidence Interval Densities") || function weight[3] - 1000 * normalden(x, `=fit[3]' , `=se[3]'), range(`=fit[3] -5' `=fit[3] +5') horiz pstyle(p2) || function fit[3], range(`=weight[3]' `=weight[3]-1000*normalden(0, se[3])') pstyle(p2) || function weight[17] - 1000 * normalden(x, `=fit[17]', `=se[17]'), range(`=fit[17]-5' `=fit[17]+5') horiz pstyle(p2) || function `=fit[17]', range(`=weight[17]' `=weight[17]-1000*normalden(0, se[17])') pstyle(p2) || function weight[21] - 1000 * normalden(x, `=fit[21]' , `=se[21]'), range(`=fit[21] -7' `=fit[21] +7') horiz pstyle(p2) || function `=fit[21]', range(`=weight[21]' `=weight[21]-1000*normalden(0, se[21])') pstyle(p2) || line fit weight, clwidth(*2) pstyle(p3)
For more information on Stata graphics, please have a look at the book A Visual Guide to Stata Graphics, 3rd Edition.