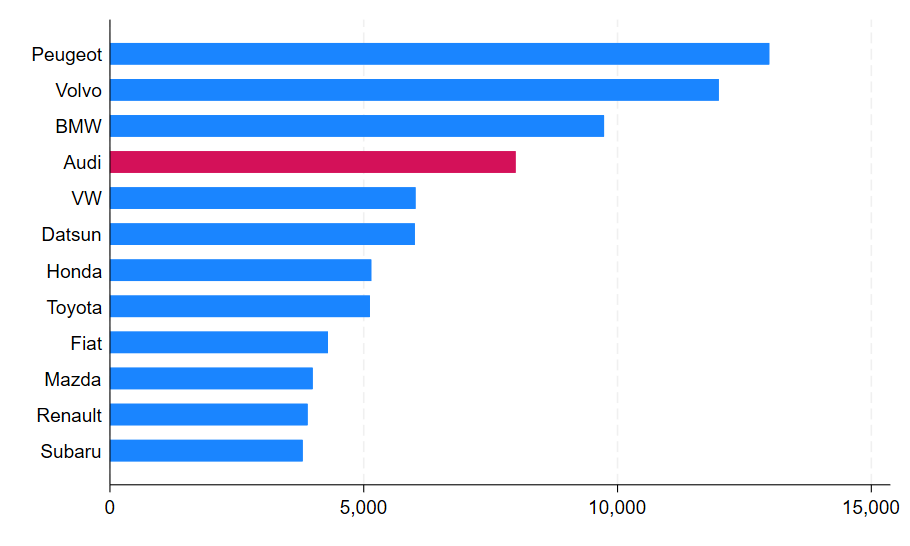
Highlighted Bar Graph
Create a bar graph where one bar is highlighted using the separate command in Stata.
To create this graph in Stata, use the following commands:
sysuse auto, clear
split make
drop make
encode make1, generate(make)
separate price, by(make==2)
graph hbar (mean) price0 price1 if foreign == 1, nofill over(make, sort((mean) price) desc) legend(off)