Odds Ratio Graph with Ordered Bar
You can order the bars when creating an odds ratio graph by sorting observations into your chosen order and then generating a variable containing the ordered numbers.
To create this graph in Stata, you first need to download two commands from the SSC, which you can do in Stata with the following commands:
ssc install parmest
ssc install egenmore
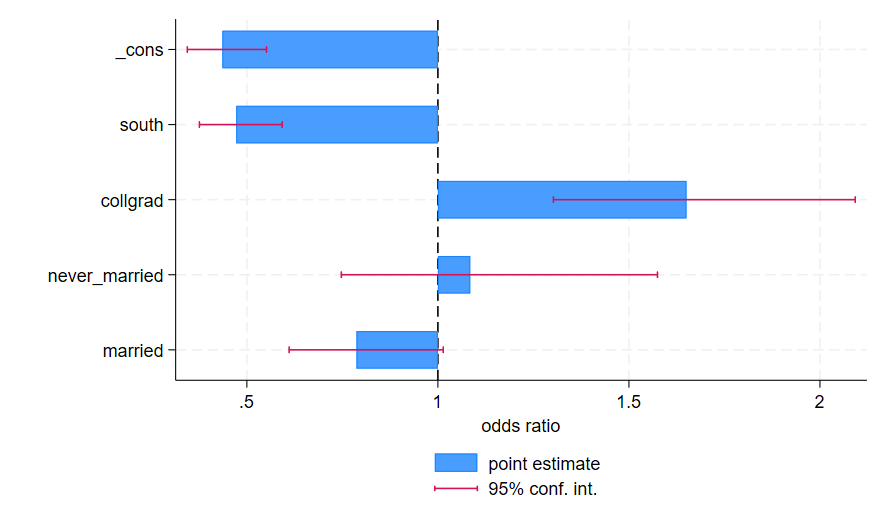
To generate this graph in Stata, use the following commands:
sysuse nlsw88, clear
logit union married never_married collgrad south
parmest, norestore eform
tabulate estimate, generate(est)

input byte a
1
2
3
4
5

egen axis= axis( a estimate), label(parm)

twoway bar estimate axis, base(1) horizontal barw(.5) xline(1) ylab(, valuelabel angle(0)) || rcap min95 max95 axis, horizontal legend(order(1 "point estimate" 2 "95% conf. int.") pos(6)) xtitle("odds ratio") ytitle("")