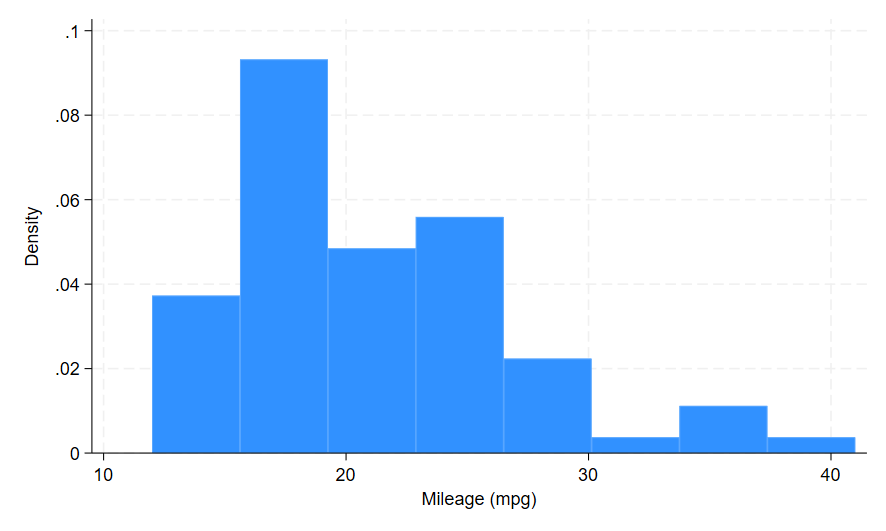
Jacob WhiteJan 21, 20201 min readSimple HistogramThe Histogram is a very effective graph for displaying a certain measured result in comparison to a certain constant. In this case, the mileage is compared to the density within the auto data set.The graph can be created using this code:Stata•Graphs7 views0 comments1 like. Post not marked as liked1
The Histogram is a very effective graph for displaying a certain measured result in comparison to a certain constant. In this case, the mileage is compared to the density within the auto data set.The graph can be created using this code: