Strip Plot in Stata
A strip plot will graph a series of marks or letter-codes along a magnitude X-axis. To run a strip plot in Stata you will need to download the command from the SSC repository. You can do this with the following command:
ssc install stripplot
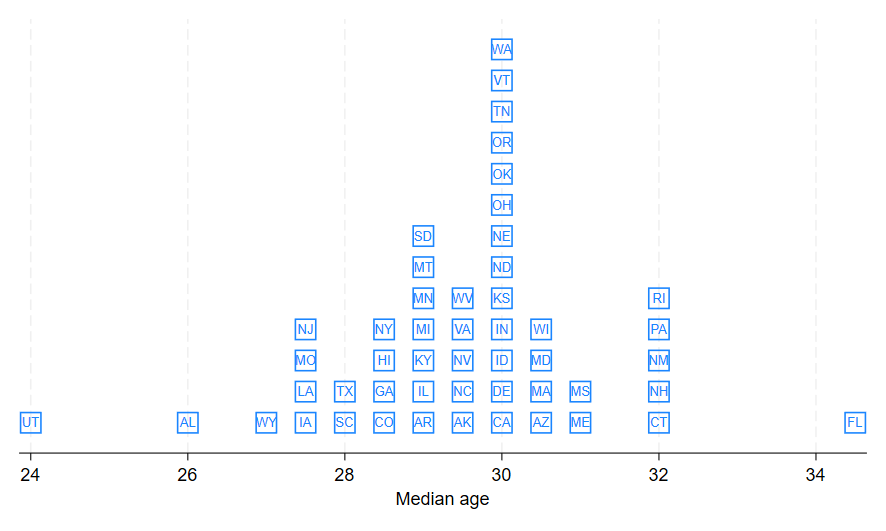
To generate the plot above use the following commands:
sysuse census, clear
local abbrev AK AL AR AZ CA CO CT DE FL GA HI IA ID IL IN KS KY LA MA MD ME MI MN MO MS MT NC ND NE NH NJ NM NV NY OH OK OR PA RI SC SD TN TX UT VA VT WA WI WV WY
generate abbrev = ""
tokenize "`abbrev'"
quietly forvalues i = 1/50 {
	replace abbrev = "``i''" in `i'
}
stripplot medage, stack msymbol(square_hollow) msize(*3.5) width(0.5) mlabel(abbrev) mlabpos(0) mlabsize(*.9) yscale(off)
For a comprehensive exploration of the many Stata graph commands and options, check out the book A Visual Guide to Stata Graphics.