Survival Curve with Confidence Intervals Graph
You can add confidence intervals as a range to your survival curve Stata graph. For example:
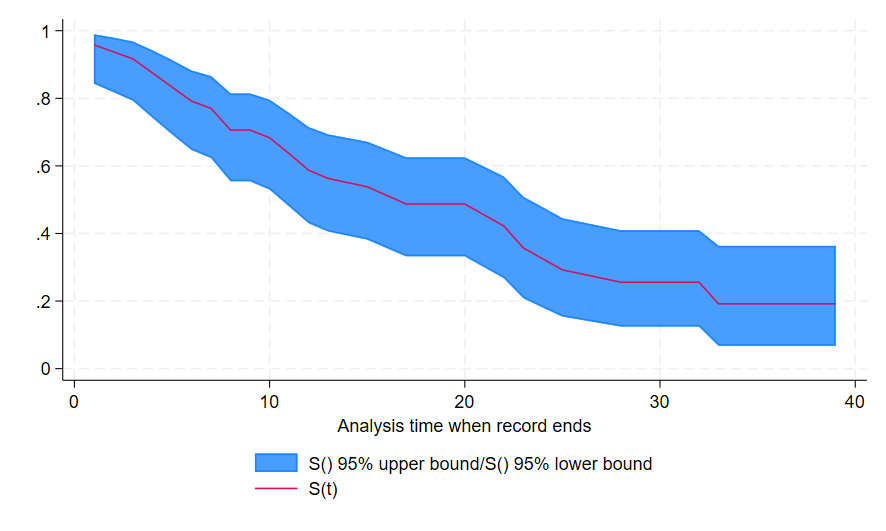
use http://www.stata-press.com/data/r11/drug2.dta, clear
stset
sts gen km=s
sts gen ub=ub(s)
sts gen lb=lb(s)

twoway (rarea ub lb _t, sort) (line km _t, sort), legend(position(6))
To learn more about different Stata graphs and how to use them, check out the book A Visual Guide to Stata Graphics at our bookstore.