Transparency Highlights Overlap in Range Area Graphs in Stata
You can use the new transparency graph option to make it easy to see where two areas overlap for all of Stata’s range graphs. In this example we look at how to use transparency to see the overlap in a Stata range area graph.
To use transparency in Stata you add %num after the colour you specify in color() - e.g. color(red%num). If you don’t specify a color but still want transparency, just put color(%num). The number num will be an integer between 0 and 100, depending on how transparent you want your colour to be.
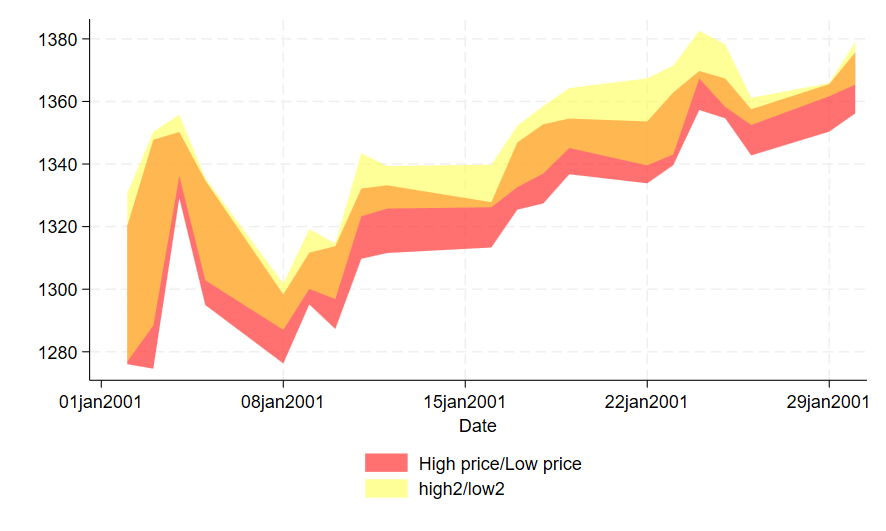
To generate this graph in Stata, use the following commands:
sysuse sp500
set seed 234567
generate high2 = high + 15 * runiform()
generate low2 = low + 15 * runiform()
twoway (rarea high low date, fcolor(red%70) lcolor(none%0)) (rarea high2 low2 date, fcolor(yellow%50) lcolor(none%0)) in 1/20, legend(position(6))