Adding a Title to a Graph
A descriptive title helps readers understand what a graph represents. In Stata, the title() option allows you to add a title directly to your graph and customise its size, colour and position. You can also create titles spanning multiple lines and include subtitles for additional context.
Adding a title
Using Stata’s built-in auto dataset, we can create a scatter plot comparing vehicle mileage and weight:
sysuse auto, clear
scatter mpg weight, title("Fuel efficiency by vehicle weight") name(title1)
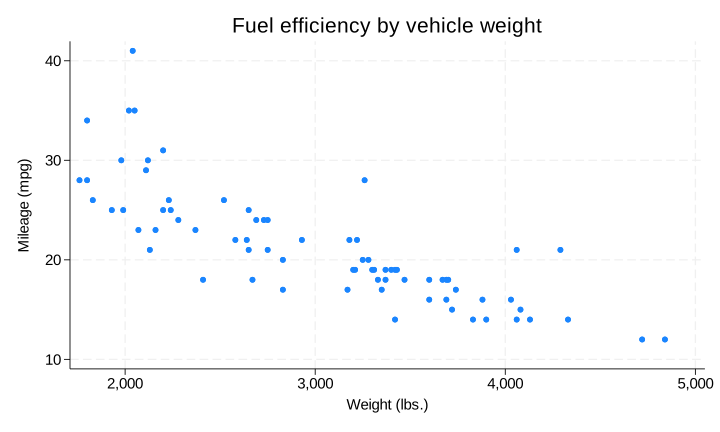
The title() option adds the specified text above the graph. This option can be included in most Stata graph commands, including scatter plots, line graphs and bar charts.
Customising the title
We can modify the appearance of the title using additional options:
scatter mpg weight, ///
     title("Fuel efficiency by vehicle weight", ///
     size(large) color(navy)) ///
     name(title2)
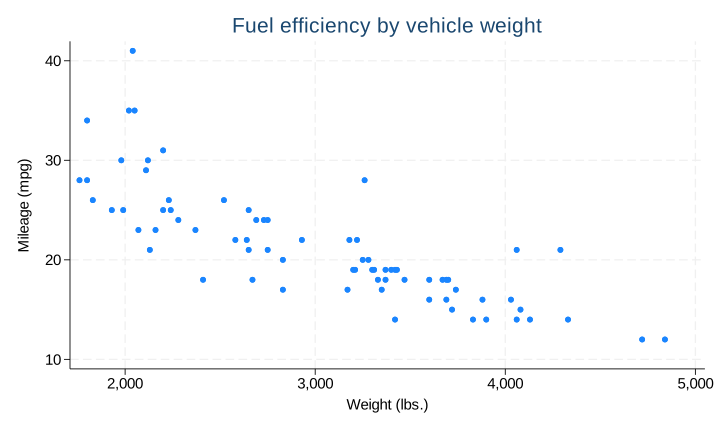
Here, size(large) increases the title’s font size, while color(navy) changes the text colour. The size can also be specified using exact measurements, such as size(16pt). To reposition the title, use the position() option. For example, position(11) places the title towards the upper-left of the graph, while position(6) moves it to the bottom.
Adding multiple lines and subtitles
Long titles can be separated into multiple lines by placing each line inside its own pair of quotation marks. We can also include a subtitle and an explanatory note:
scatter mpg weight, ///
     title("Fuel efficiency" "by vehicle weight", ///
         size(large) color(navy)) ///
     subtitle("1978 automobile data", size(small)) ///
     xtitle("Vehicle weight (pounds)") ///
     ytitle("Miles per gallon") ///
     note("Source: Stata auto dataset", size(vsmall)) ///
     name(title3)
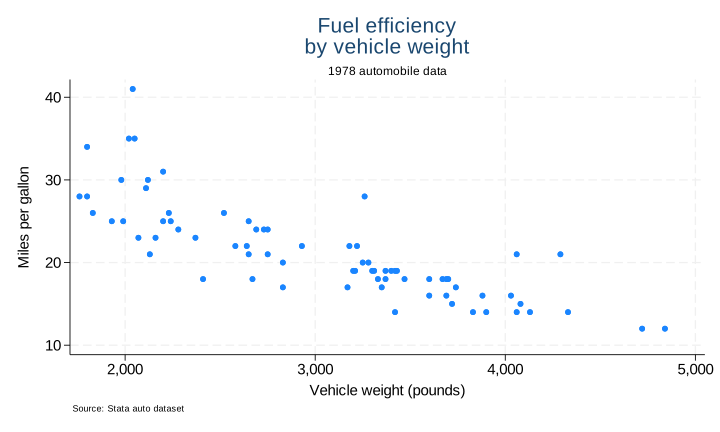
The subtitle() option adds a secondary heading beneath the main title, while note() places additional information at the bottom of the graph. The xtitle() and ytitle() options label the horizontal and vertical axes, respectively.
These options allow you to create informative, consistently formatted graphs directly through Stata commands without requiring manual editing.
Alternatively, you can add or change titles interactively using Stata’s Graph Editor, which allows you to modify their text, size, colour and placement.