Clustered Categories Graph
This type of graph displays two different data sets and then the mean of both in the same chart with a gap between for legibility. This is effective for displaying the mean of two different variables against one constant,
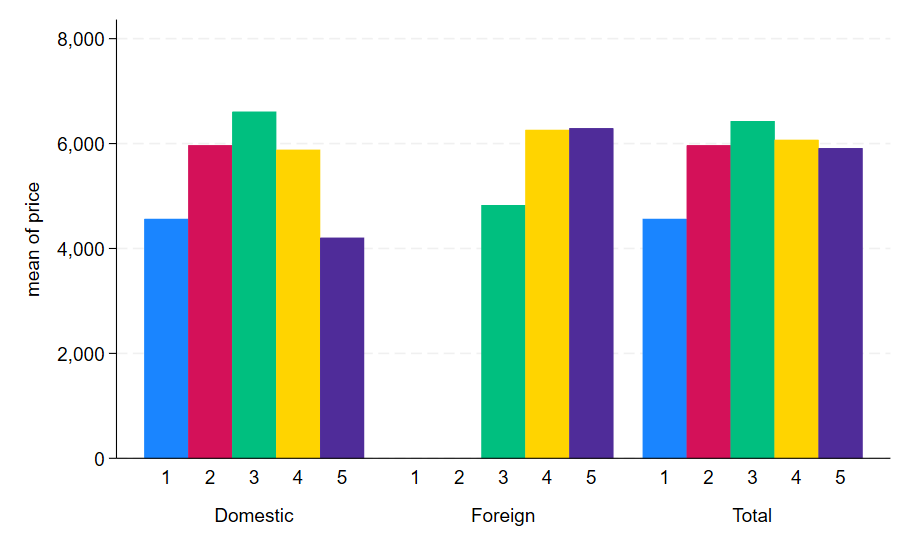
This code can be used to create a clustered categories graph:
sysuse auto, clear
save auto1 , replace
replace foreign = 3
label define origin 3 Total, add
append using auto1
graph bar (mean) price, over(rep78) over(foreign) showyvars ascategory asyvar legend(off)