Bulleted Text Displays as a Graph
Bulleted text can be used to portray information in many ways. The following graph makes use of bulleted text to list the ways that Stata can create personalized graphs for all your needs.
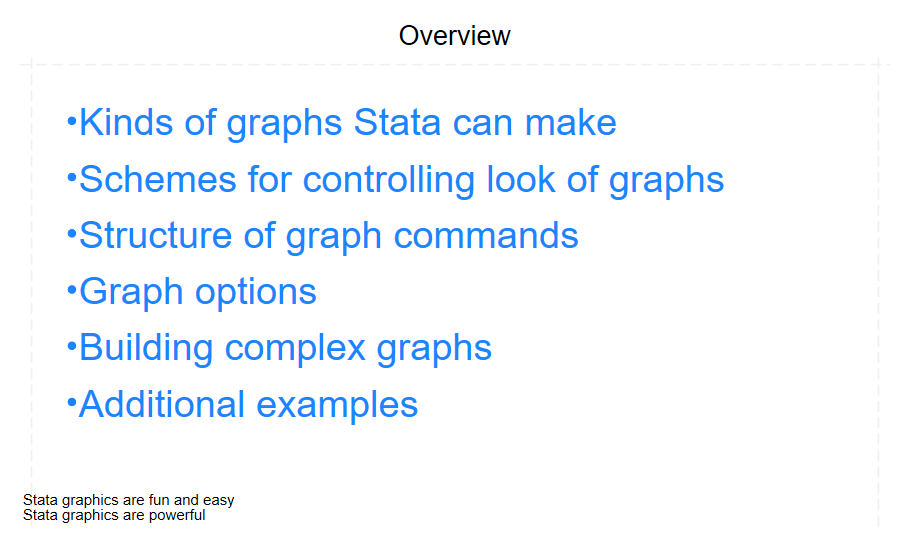
The code below will create this exact graph:
twoway (scatteri 6 0 "Kinds of graphs Stata can make", mlabsize(huge) pstyle(p1))
 (scatteri 5 0 "Schemes for controlling look of graphs", mlabsize(huge)
 pstyle(p1)) (scatteri 4 0 "Structure of graph commands", mlabsize(huge)
 pstyle(p1)) (scatteri 3 0 "Graph options", mlabsize(huge) pstyle(p1))
 (scatteri 2 0 "Building complex graphs", mlabsize(huge) pstyle(p1))
 (scatteri 1 0 "Additional examples", mlabsize(huge) pstyle(p1)),
 title("Overview") xlabel(-.05 1) ylabel(-1 7) xscale(off) yscale(off)
 legend(off)
 note("Stata graphics are fun and easy" "Stata graphics are powerful", ring(0))