Make your graphs stand out
When I attend conferences and presentations it is usually quite easy to spot those presenters who have prepared their graphs in Stata, especially those who have not spent time to make their graphs look great. The stock standard Stata graph is generic.
sysuse auto

twoway (scatter length weight if foreign)(scatter length weight if !foreign)
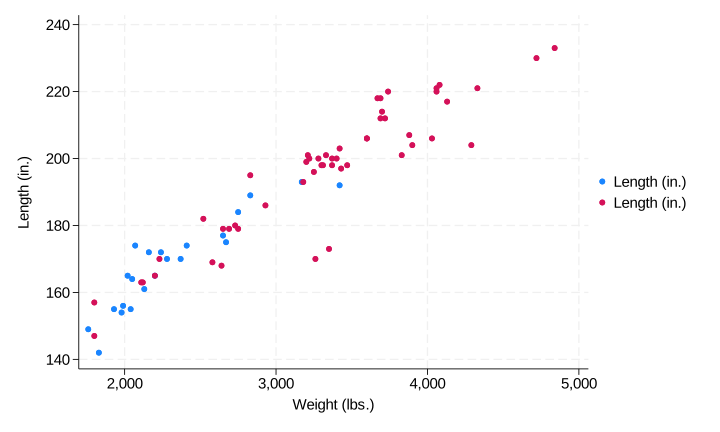
In the TechTip Adding a Title to a Graph, you can learn how to add a title to a graph and change that title to make it suit your graph. You can also change almost every aspect of a graph through various graph options. One of those options is the scheme option. Stata has a series of built in schemes. Theses are:
- stcolor - which uses colours on the foreground and a white background
- stmono1 - which has a monochrome foreground and a white background
- stmono2 - which has a monochrome foreground and a white background
- stgcolor - which is a coloured graph specifically design for the Stata manuals
- stcolor_alt - which is like stcolor but with modified dimensions and a legend
- stgcolor_alt - which is like stgcolor modified for the Stata manuals
- stsj - which is a monochrome scheme and is the official scheme for the Stata Journal
- s2color - which was the default scheme before Stata 18 (you would recognise the green background)
- s2mono - which is the monochrome version of s2color
- s2gcolor - which is a colour scheme previously used for the Stata manuals
- s2manual - which is a monochrome version of s2gcolor
- s2gmanual - which is is a monochrome version previously used in the Stata Graphics manual
- s1rcolor - which is a colour version with a black background
- s1color - which is a colour version with a white background
- s1mono - which is a monochrome version of s1color
- s1manual - which is a smaller version of s1mono
- economist - which is a colour scheme designed specifically for use in the Economist Magazine
- sj - which is a monochrome scheme with a white background previously used in the Stata journal.
You can also install other schemes and create your own. Laura from our team has created some schemes which are available on TechTips - search for schemes. Asjad Naqvi of Vienna University also publishes numerous schemes available at https://github.com/asjadnaqvi/stata-schemepack.
To use an alternate scheme you include the option scheme(name_of_scheme) in your command like this:
twoway (scatter length weight if foreign)(scatter length weight if !foreign), scheme(stmono1)
This command creates the same plot as the one above but uses the stmono1 scheme.
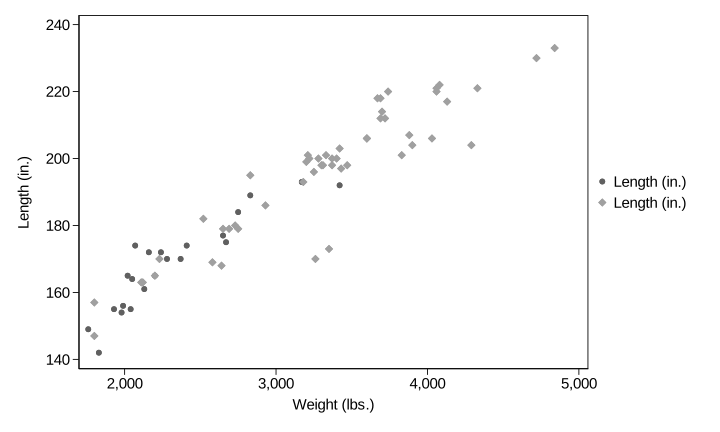
Note that this new graph uses monochrome scaling with a distinct border around the plot region. We see the distinction of the foreign cars from the domestic cars by different markers and the application of the monochrome scaling.
Let’s use this same plot now to show some of the better known schemes:
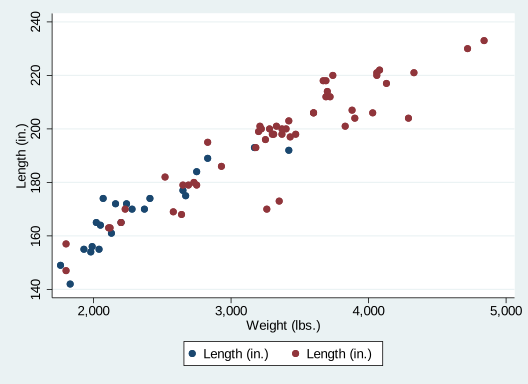
s2color - the Stata scheme prior to release 18
twoway (scatter length weight if foreign) (scatter length weight if !foreign), scheme(s2color)
stgcolor
twoway (scatter length weight if foreign) (scatter length weight if !foreign), scheme(stgcolor)
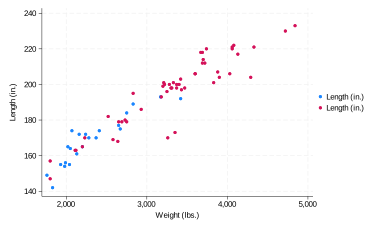
Note: the scheme is also able to control the size of the plot, the markers, legend etc.
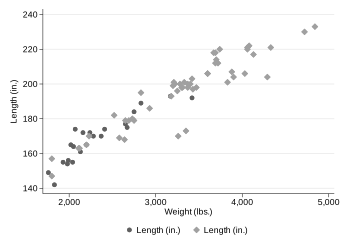
stsj
twoway (scatter length weight if foreign) (scatter length weight if !foreign), scheme(stsj)
economist
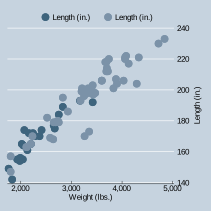
twoway (scatter length weight if foreign) (scatter length weight if !foreign), scheme(economist)
Other schemes
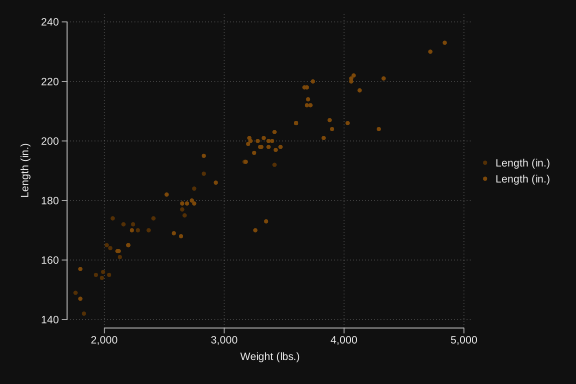
I happen to have Asjad's Schemepack installed on my computer. Here are some of my favourites from his schemepack.black_brbg
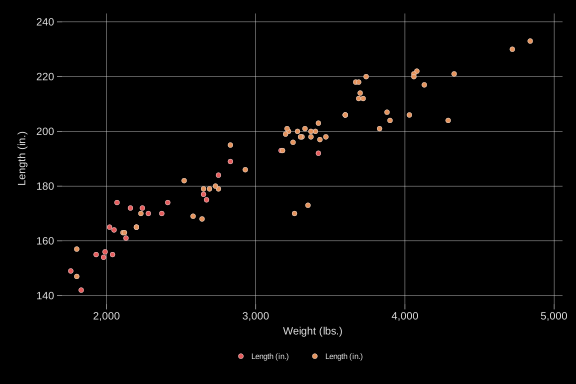
twoway (scatter length weight if foreign) (scatter length weight if !foreign), scheme(black_brbg)
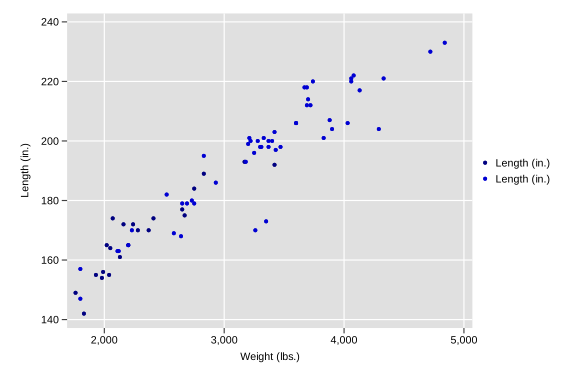
gg_jet
twoway (scatter length weight if foreign) (scatter length weight if !foreign), scheme(gg_jet)
neon
twoway (scatter length weight if foreign) (scatter length weight if !foreign), scheme(neon)
So when it comes to creating your plots for your next Stata presentation or poster, why not try using a different scheme or creating your own to make your graphs stand out from the crowd, or why not work with your organisation’s marketing team to choose the colours and sizing that makes it simple for everyone in your organisation to show the right colours for your organisation.